
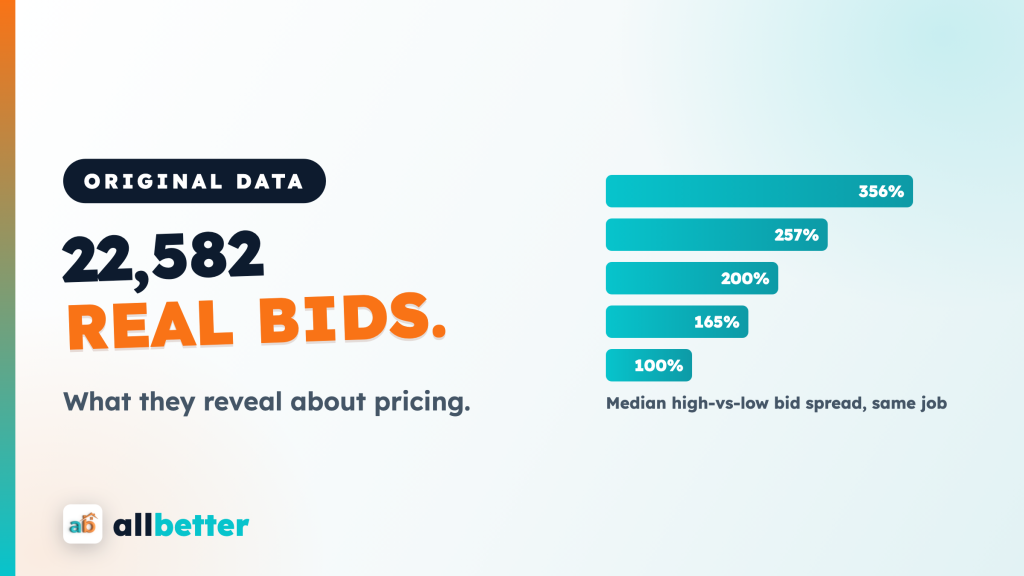
Most “what does it cost” content in home services is sourced from surveys and scraped averages. This report is different: it’s built from 22,582 individual contractor bids on real U.S. jobs posted to the AllBetter marketplace — actual prices real pros offered for real work. Platforms many times our size publish none of this; bid-level pricing data simply doesn’t exist anywhere else in home services. We’re publishing the topline numbers so homeowners, contractors, and researchers can use them. Cite freely with attribution.
What does real bid data show about home services? Three things: prices for identical work vary enormously (the median gap between the highest and lowest bid on the same job is 140%); most homeowners genuinely don’t know what work costs (89% post jobs without naming a budget); and markets reward speed (in AllBetter’s top metros the median first bid arrives in about 10 minutes).
Check your inbox for a confirmation email.
Finding 1: The Same Job Gets Wildly Different Prices
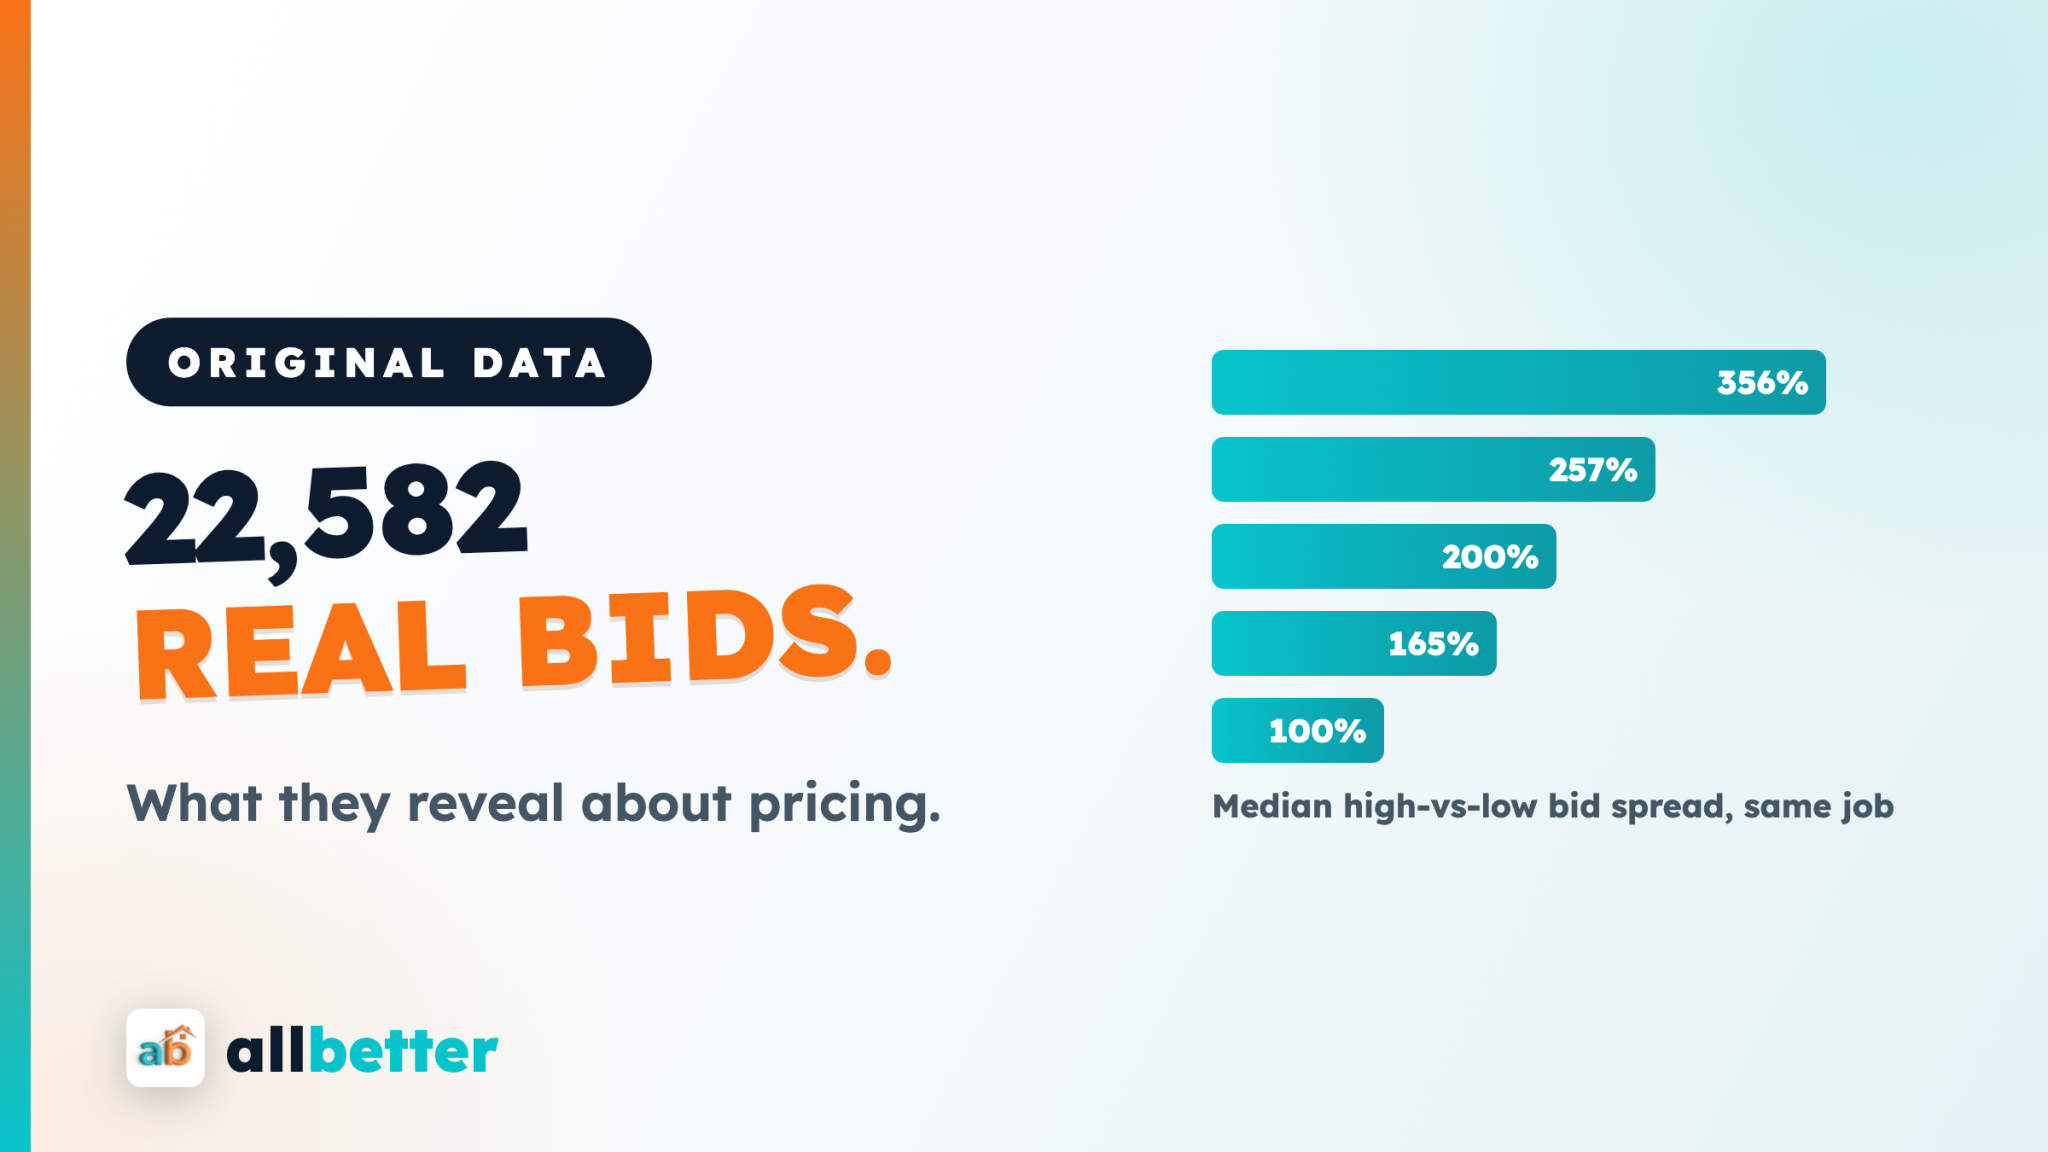
Across every job that received two or more priced bids, the median spread between the highest and lowest bid was 140% — and on 59% of jobs, at least one bid was more than double another. This is the single most consequential number in home services: it means accepting the first (or only) quote is routinely a three-figure mistake on identical scope.
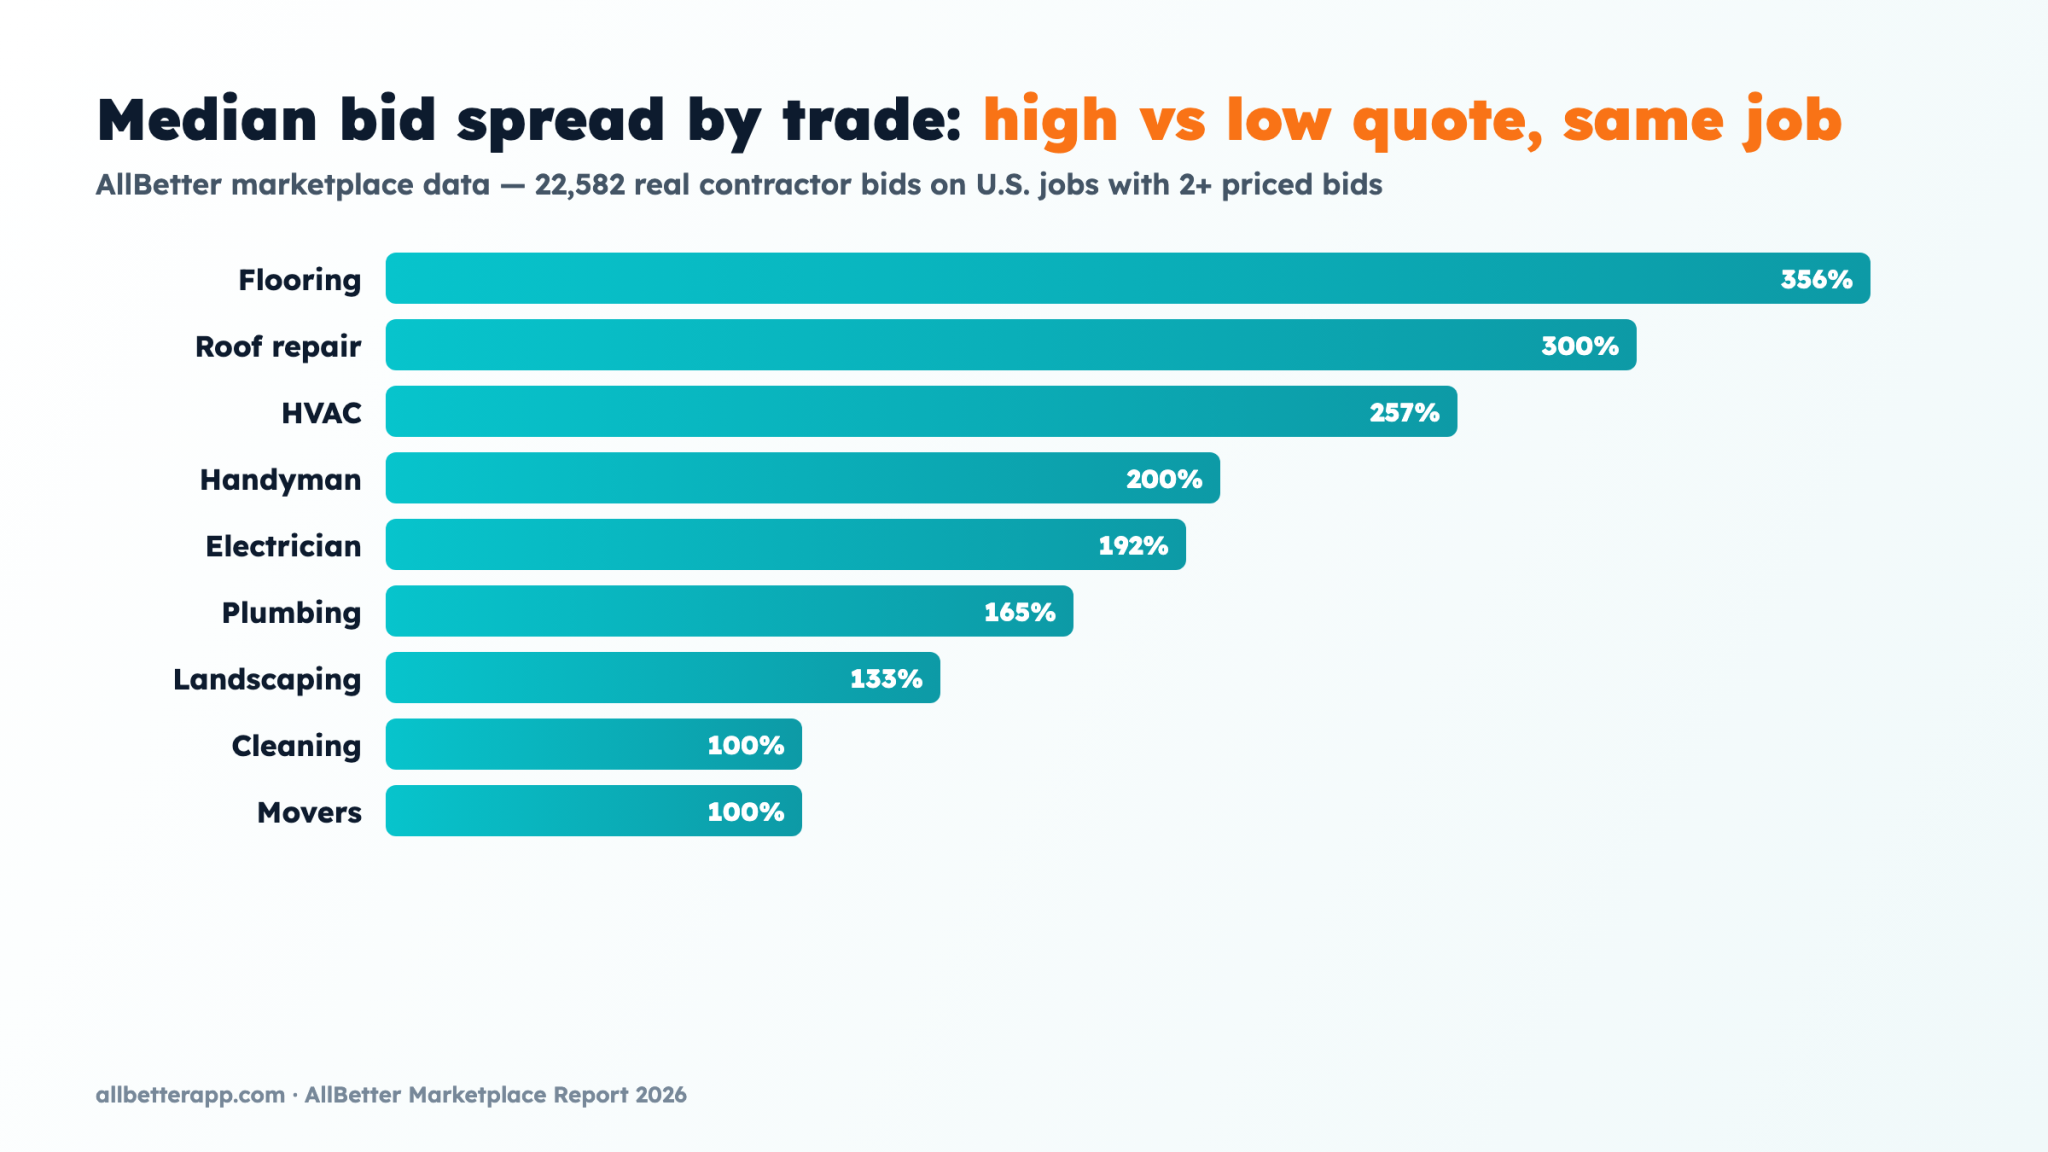
The pattern: the more diagnosis a trade involves, the wider the spread. Flooring, roofing, and HVAC bids price unknowns; cleaning and moving price hours. Small-sample trades (roof repair, HVAC, flooring) carry wider uncertainty — treat their exact figures as directional. Our cleaning-spread deep dive unpacks what drives the gap inside one trade.
Finding 2: 89% of Homeowners Don’t Name a Budget
Across the full dataset, 89.4% of jobs were posted “open to bids” with no budget specified. The information gap is the product: most people simply don’t know what work should cost, which is exactly the gap that lead-sale platforms monetize and that platform fee structures quietly widen. It’s also why we publish trade-by-trade cost guides — pricing literacy is the cheapest home-services upgrade there is.
Finding 3: Active Markets Move in Minutes

Among jobs that received bids, 38.4% saw their first bid within 15 minutes and half within the hour. Concentration matters: in our five most active metros (Chicago, New York, Los Angeles, Houston, Miami) the median time to first bid is about 10 minutes — in Chicago, our home market, it’s 8 minutes. The long tail is real too: about 3 in 10 first bids take more than three days, typically in thin markets and specialty trades.
See the spread on your own project. Post it free, compare real bids from verified pros, and pay through escrow only when the work is approved.
Methodology
Source: every job posted on the AllBetter marketplace over a multi-year window through June 2026. Internal test records and non-U.S. postings were excluded; bid-level analysis covers all jobs with two or more priced bids — 22,582 bids in total. Spread = (highest bid − lowest bid) ÷ lowest bid per job, reported as medians to resist outliers. Time-to-first-bid is measured from posting timestamp to first bid timestamp among jobs that received bids. Per-trade sample sizes range from 23 jobs (roof repair) to 1,722 (cleaning); small-sample trades should be read as directional. We do not publish job-completion rates because off-platform completions make them undercount unreliably. AllBetter operates this marketplace — the incentive disclosure is that bid-comparison data naturally favors bid-comparison platforms; the raw distributions are reported as computed either way.
Citing this report: journalists, researchers, and creators may cite any figure with attribution to “AllBetter Marketplace Report 2026” and a link to this page. For the underlying aggregate tables, contact us.
Data Report: FAQ
How much do contractor quotes vary for the same job?
In AllBetter marketplace data (22,582 bids on multi-bid U.S. jobs), the median gap between the highest and lowest bid on the same job is 140%, and 59% of jobs see at least one bid more than double another. Diagnosis-heavy trades like flooring (356%) and HVAC (257%) vary most.
How many bids should I get for a home project?
At least three. The median multi-bid job on AllBetter receives 3 bids, and with a 140% median spread between high and low quotes, the third bid is routinely worth hundreds of dollars of information on identical work.
How fast do contractors respond to job posts?
In active metros, fast: the median first bid in AllBetter’s top five markets arrives in about 10 minutes (Chicago: 8 minutes). Across all markets, 38.4% of first bids land within 15 minutes and half within an hour, with a long tail in thin markets and specialty trades.
Where does this data come from?
From the AllBetter marketplace itself: 22,582 real contractor bids across thousands of U.S. job posts, with test records and non-U.S. posts excluded. The full data window, sample sizes, and exclusion rules are published in the methodology section above.